Antares Coupling is 3,000% more profitable than competitor
Did you know that the Antares coupling is 3,000% more profitable than the competitor? Tests prove that, under severe conditions, Antares couplings perform 347% better than second place and 3,191% better than fourth place.
The test laboratory has always been part of Antares’ product development and quality routine. Over the past four years, the factory has incorporated exhaustive comparative tests into this practice, which evaluate the performance of Antares couplings in comparison with other brands available on the market*.
The tests are conducted based on procedures and methodology defined in conjunction with certifying advice and were developed considering testing standards and the theory of destructive and life tests. In short, when we implemented the tests, our objective was to quantify what our customers already know in practice: that the Antares coupling is certainly worth much more per real invested.
We apply life tests to all competitors with the same test torque, approving those that exceed 50,000 cycles. Observe the durability of the couplings of each brand, submitted to an alternating torque (which varies between positive and negative, with an average torque close to zero), measuring how many cycles the part supports before breaking. This is without even considering the damage caused by a machine stopping before its time, obviously.
Even if the conditions are not so severe, above all, the life test results indicate that Antares couplings mean savings and machine availability throughout its life cycle.
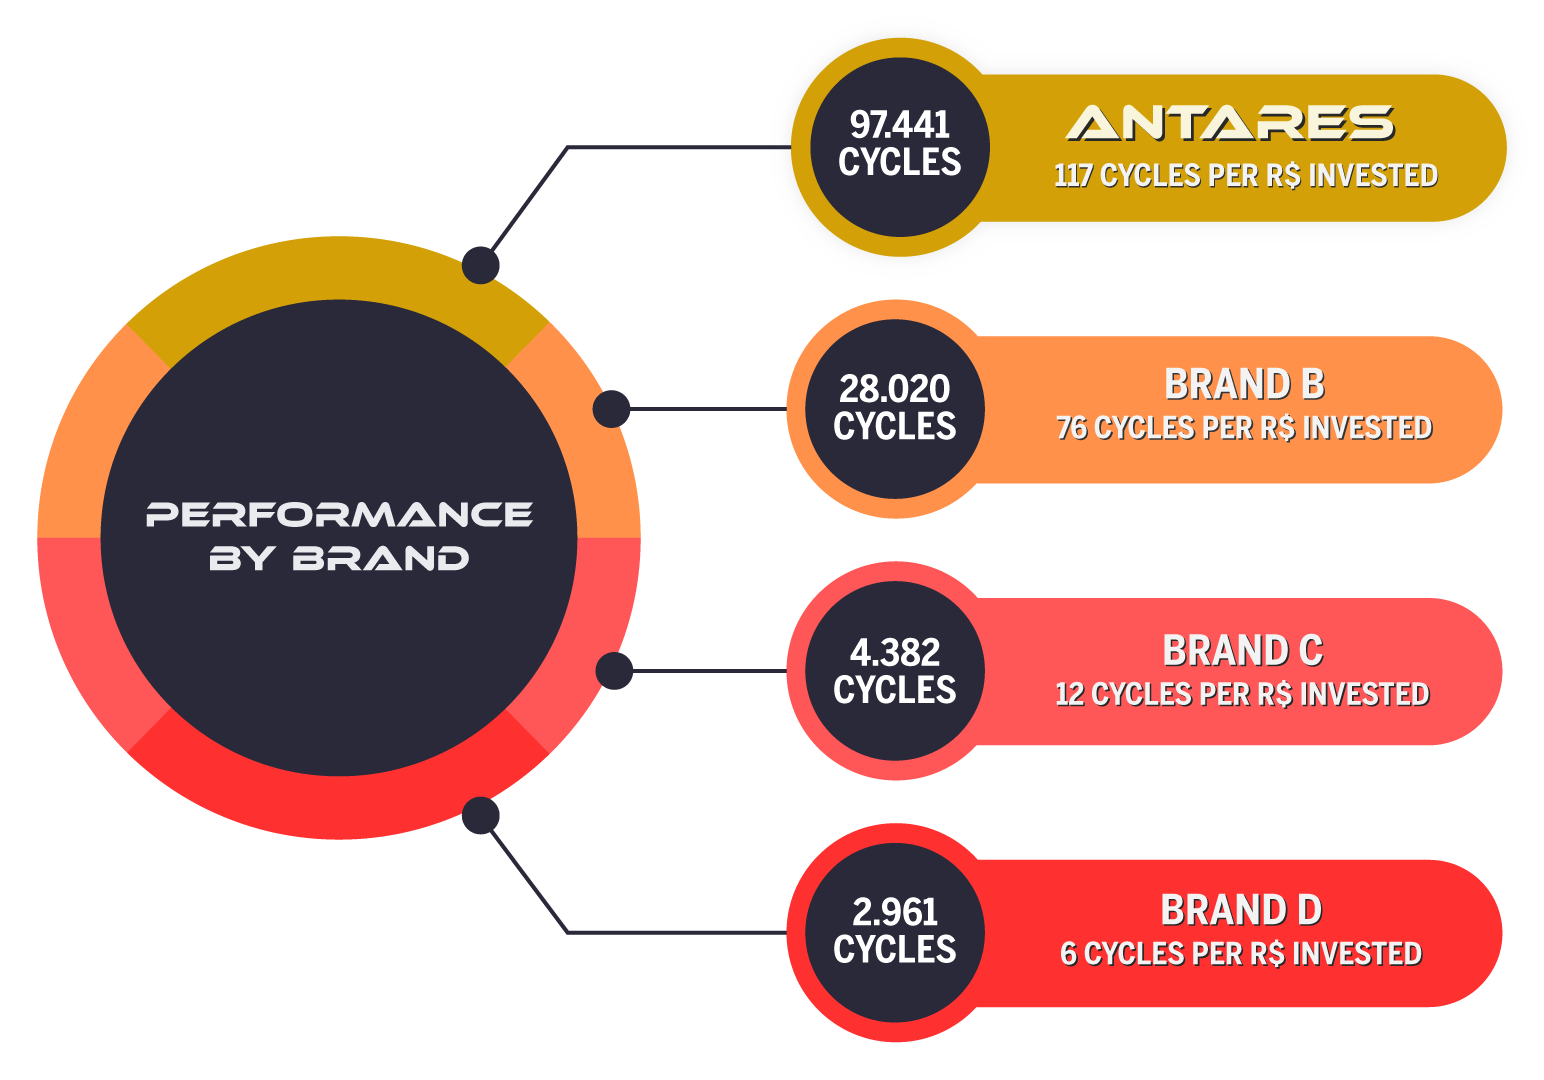
- ANTARES: 97,441 cycles
- MARK B: 28,020 cycles
- MARK C: 4,382 cycles
- MARK D: 2,961 cycles
SAVINGS PER R$ INVESTED
Furthermore, Antares durability and performance have an impact on the economy within the industry. The tests are assertive in demonstrating that the Antares product has a performance of 117 cycles per R$ invested, while the D Brand has only 6 cycles, for example.
Follow:
- ANTARES: 117 cycles/R$ invested
- BRAND B: 76 cycles/R$ invested
- BRAND C: 12 cycles/R$ invested
- BRAND D: 6 cycles/R$ invested
Namely, we must confront these results with the acquisition costs. We divide the results in cycle numbers by the acquisition cost of each coupling. Consequently, we arrive at the indicator of cycles per R$ invested.
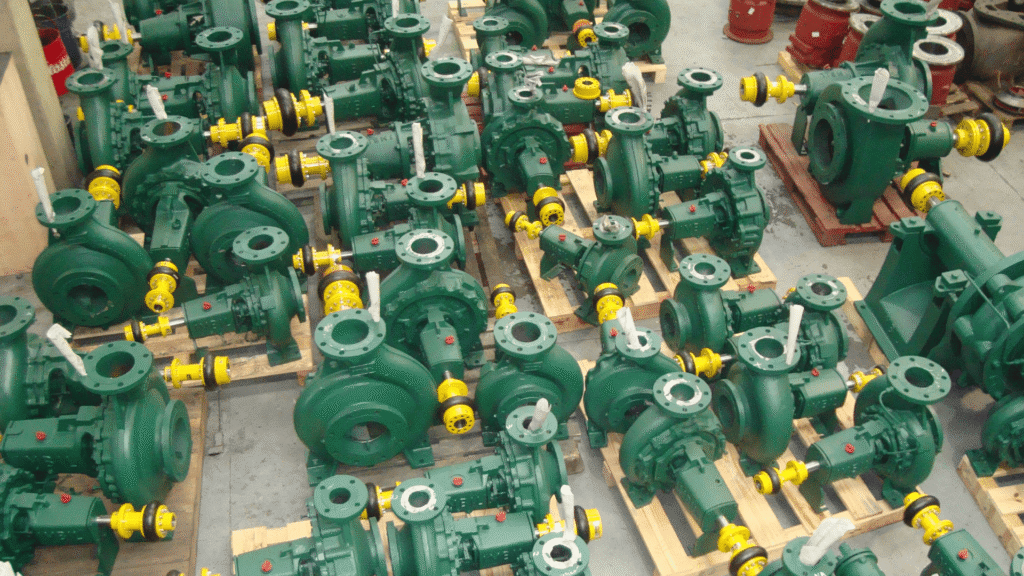
That is, quality and performance revert to safety and economy on the factory floor. The thousands of products installed in the most demanding sectors, working 24/7 leave no doubt.
* We tested the other widely known brands, which have a large share in the Brazilian market.
Suzana Facilito relacionamentos através das ações e ferramentas construídas a partir do marketing estratégico e digital.